Blue and White Minimalist Market Research Solutions Instagram Post

Why Companies Fail: The Role of Marketing and Data Research

Starting and running a successful business in today’s world is no small feat. Many companies launch with big dreams and ambitions, but a shocking number of them fail to make it. Why does this happen? Often, it’s because they underestimate the importance of solid marketing and effective data research. 

These aren’t just words, they’re lifelines for any business. Without them, companies are essentially flying blind.

Marketing isn’t just about running ads or posting on social media. It’s about understanding your audience and solving their problems. 

Here’s where many companies go wrong:

  1. Guesswork Over Research: Some companies think they know what their audience wants without asking.
  2. One-Size-Fits-All Strategy: Copying what worked for another company rarely works for you.
  3. Ignoring Consistency: Marketing needs to be consistent and engaging over time.


Data isn’t just numbers on a spreadsheet, it’s the foundation of smart business decisions. If you’re not using it correctly, you’re bound to get lost. Unfortunately, many companies don’t use data the way they should and below are various ways they stumble:

  1. Using Outdated Data: Relying on old trends is like trying to navigate a city with a five-year-old map. Markets change rapidly, and outdated data can lead to disastrous decisions.
  2. Misinterpreting Data: Numbers can tell a story, but if you’re not fluent in their language, you might read them wrong. For instance, a spike in sales might seem like a win, but without deeper analysis, you might miss that it was seasonal or tied to a one-time event.
  3. Not Gathering Enough Data: Making decisions based on limited information is like guessing the weather by looking out the window. You need a broader, more detailed perspective to make informed choices.
  4. Data Overload Without Action: Collecting mountains of data but failing to act on it is another common mistake. Data is only as good as the insights and actions it inspires. Businesses often get stuck analyzing without implementing, which leads to missed opportunities.


At Arise SLG, we specialize in marketing and data research to help businesses succeed. From understanding your audience to crafting strategies that work, we’re here to guide you every step of the way. Don’t let poor decisions, lack of data research, or an absence of strategy deny your business the prosperity it deserves—take advantage of our services to turn your challenges into opportunities and achieve the business prosperity you deserve.

Are you ready to take your business to the next level? Visit our website at ariseslg.org  and let’s get started!


#AriseSLG #BusinessSuccess #DataDrivenGrowth #businessintelligence #dataanalytics #datainsights #businessgrowth #dataforbusiness #dataexperts #marketinganalytics

Arise SLG 524 (1)

Unlocking the Power of Microsoft Excel: Beyond Spreadsheets

Microsoft Excel is often regarded as the Swiss Army knife of data management. For decades, it has been a staple tool for businesses, educators, researchers, and individuals alike. Yet, many users only scratch the surface of Excel’s capabilities, unaware of its transformative potential for data analysis, visualization, and automation. Let’s dive into how Excel goes beyond basic spreadsheets to become a powerhouse for efficiency and insights.


  1. Data Analysis and Insights Made Easy

Excel’s robust suite of formulas and functions is the foundation of its analytical power. Whether calculating sales forecasts, analyzing customer trends, or managing project budgets, Excel enables users to derive insights with precision.

  • PivotTables: Simplify complex datasets into digestible summaries, enabling trend identification and actionable insights in seconds.
  • Data Analysis ToolPak: A hidden gem, this add-on offers advanced statistical analysis tools such as regression, t-tests, and histograms.

For Instance, a retail company can use Excel to analyze customer purchasing patterns, segment them by demographic, and adjust marketing strategies based on insights.


  1. Visualizing Data with Stunning Clarity

Numbers alone can be overwhelming, but Excel bridges the gap with its powerful visualization tools.

  • Charts and Graphs: Create bar charts, scatter plots, or interactive dashboards to make data storytelling more compelling.
  • Conditional Formatting: Highlight key trends, outliers, or thresholds with intuitive color codes and icons.
  • Dynamic Dashboards: Combine slicers, charts, and PivotTables to build interactive dashboards for real-time data exploration.

For Instance, a financial analyst can use Excel to visualize quarterly performance across regions, enabling stakeholders to make informed decisions quickly.


  1. Automation with Macros and VBA

Repetitive tasks can bog down productivity, but Excel offers solutions to automate workflows efficiently.

  • Macros: Record sequences of actions to automate repetitive tasks, such as formatting reports or reconciling data.
  • VBA (Visual Basic for Applications): For more advanced users, VBA scripts allow for custom automation solutions tailored to specific needs.

For Instance, an HR department can automate generating employee performance reports across departments, saving hours of manual effort each month.


  1. Collaboration and Cloud Integration

With Microsoft 365, Excel has evolved into a cloud-based tool, enhancing collaboration and accessibility.

  • Real-Time Collaboration: Multiple users can work on the same spreadsheet simultaneously, making teamwork seamless.
  • Integration with Other Tools: Connect Excel with Power BI, Microsoft Teams, and SharePoint to streamline workflows.
  • Data Sharing: Use OneDrive to securely share spreadsheets and dashboards with stakeholders worldwide.

For Instance, a global supply chain team can update inventory levels in real-time, ensuring all stakeholders have access to the latest data.


  1. Excel’s Role in Modern Business Intelligence

While standalone BI tools like Tableau and Power BI are gaining traction, Excel remains an integral part of the BI ecosystem.

  • Power Query: Extract, transform, and load (ETL) data from multiple sources effortlessly.
  • Power Pivot: Perform in-memory data modeling to analyze massive datasets.
  • Integration: Excel seamlessly integrates with other BI tools, making it a bridge between traditional and modern analytics.

For Instance, a marketing team can use Power Query to combine data from social media platforms and CRM systems, creating a unified view of campaign performance.


  1. Accessibility for All Skill Levels

One of Excel’s greatest strengths is its accessibility. From beginners to advanced users, Excel offers a scalable learning curve.

  • Templates: Pre-built templates for budgeting, project tracking, and data visualization simplify initial adoption.
  • Community and Resources: A vast ecosystem of tutorials, forums, and user guides makes self-learning easy.

For Instance, a small business owner can use Excel templates to manage expenses and forecast growth without prior technical expertise.


Conclusion: Excel as a Lifelong Partner

Microsoft Excel is not just a tool; it’s an ecosystem that adapts to the needs of its users. Whether you’re managing household expenses or building complex financial models for Fortune 500 companies, Excel provides the versatility and power to achieve your goals.

At Arise SLG, we understand the value of leveraging tools like Excel for smarter decision-making and streamlined processes. If you’re looking to maximize your team’s potential through customized Excel solutions or training, let’s connect and make data work for you.


#MicrosoftExcel #DataAnalysis #ExcelAutomation #BusinessTools #DataVisualization #AriseSLG

White and Blue Modern Pharmacy Lab Instagram Post (1)

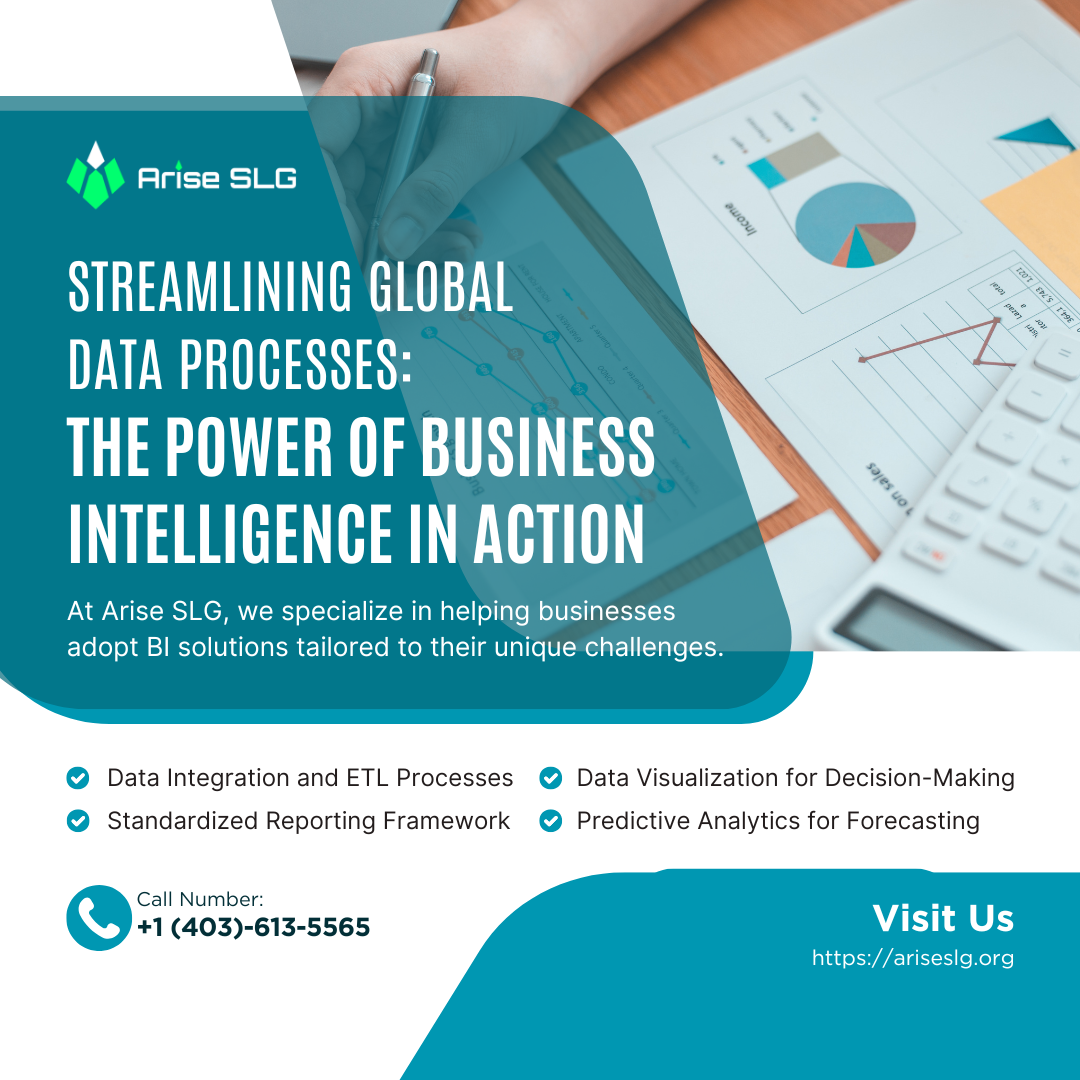
Streamlining Global Data Processes: The Power of Business Intelligence in Action

In today’s interconnected world, global companies are inundated with data from various sources—spanning geographies, markets, and platforms. Managing this vast volume of structured and unstructured data can be a daunting task. However, organizations that harness the power of Business Intelligence (BI) can transform this challenge into an opportunity.

This article explores how a multinational corporation utilized BI tools to streamline its data processes, ensuring agility, accuracy, and actionable insights across its operations.


The Challenge: Fragmented Data Ecosystem

Consider a global retail company with operations in over 50 countries. Its data sources included:

  • Point-of-Sale Systems (POS): Thousands of retail outlets generating sales data in real time.
  • E-commerce Platforms: Online purchase data varying by region and platform.
  • Supply Chain Systems: Tracking inventory, shipping, and warehouse metrics.
  • Market Data: Regional economic trends, competitor pricing, and customer demographics.

These data streams were stored across siloed systems—some using structured formats like databases and spreadsheets, while others relied on unstructured sources such as email reports, social media analytics, and market research PDFs. This fragmentation made it nearly impossible to gain a unified view of operations, resulting in:

  • Redundant data entry across teams.
  • Inconsistent reporting metrics between regions.
  • Delayed decision-making due to time-intensive data reconciliation


The Solution: Business Intelligence Implementation

To address these challenges, the company adopted a BI-driven approach, leveraging tools like Power BI and Tableau to centralize and streamline data processes. Key steps included:

  1. Data Integration and ETL Processes

Using Extract, Transform, Load (ETL) pipelines, data from disparate sources were aggregated into a central data warehouse.

  • Structured data (e.g., sales figures) was seamlessly imported from databases.
  • Unstructured data (e.g., social media sentiment) was processed using natural language processing (NLP) algorithms.
  • APIs were deployed to integrate real-time data from cloud-based platforms.
  1. Standardized Reporting Framework

The BI team created standardized dashboards accessible across regions, ensuring consistent metrics for:

  • Sales performance.
  • Inventory levels.
  • Customer satisfaction.

These dashboards automatically updated, eliminating manual data consolidation and reducing reporting errors.


  1. Data Visualization for Decision-Making

Interactive visualizations enabled stakeholders to drill down into specifics, such as:

  • Comparing regional sales trends.
  • Identifying underperforming product lines.
  • Optimizing inventory to reduce excess stock.


  1. Predictive Analytics for Forecasting

BI tools were employed to analyze historical data and predict future trends, aiding in:

  • Demand forecasting.
  • Workforce planning for peak seasons.
  • Risk mitigation in supply chain disruptions.


Real-Life Success Story: Impact on Operations

Within six months of adopting BI tools, the company reported significant improvements:

  • Reduced reporting time by 40%, as automated dashboards replaced manual processes.
  • Enhanced collaboration across teams, as a unified data source ensured consistency.
  • Improved decision-making, with executives now relying on real-time insights to identify growth opportunities.
  • Cost savings of $1.2 million, attributed to optimized inventory management and reduced redundancies.


Lessons for Other Global Organizations

Global companies looking to streamline their data processes can learn from this example. Key takeaways include:

  • Invest in Robust BI Tools: Platforms like Power BI and Tableau offer scalable solutions for managing large datasets.
  • Embrace Automation: Automating data collection and reporting reduces errors and improves efficiency.
  • Unify Siloed Data Sources: Centralizing data storage ensures a single source of truth for all stakeholders.
  • Leverage Predictive Analytics: Anticipating future trends helps mitigate risks and seize opportunities.


Conclusion

In an era where data is the lifeblood of business success, global companies must leverage Business Intelligence to stay competitive. By streamlining data processes through integration, automation, and visualization, organizations can transform fragmented data into actionable insights that drive growth.

At Arise SLG, we specialize in helping businesses adopt BI solutions tailored to their unique challenges. Whether you’re managing global operations or seeking localized insights, our expertise ensures you unlock the full potential of your data.


#BusinessIntelligence #DataStreamlining #GlobalSuccess #BIInsights #DataAnalytics #PowerBI #Tableau #AriseSLG


_Instagram Posti

The Power of Data-Driven Decision Making in Business

In today’s fast-paced business environment, making informed decisions quickly is crucial. Data-driven decision-making (DDDM) empowers organizations, and at Arise SLG, we specialize in helping businesses leverage data analytics for strategic planning and operational improvements. Here’s why adopting a data-driven approach is essential for success:

  1. Enhanced Accuracy

Relying on data reduces the risk of errors associated with gut feelings or anecdotal evidence. At Arise SLG, we assist organizations in implementing data management practices that ensure accurate forecasting and assessments.

  1. Informed Strategies

Data analytics provides insights into customer behavior, market trends, and operational performance. We help companies analyze this information to tailor their strategies effectively, meeting market demands head-on.

  1. Increased Efficiency

Data-driven processes streamline operations by identifying inefficiencies. Our expertise enables organizations to optimize resource allocation, enhancing productivity and leading to significant cost savings.

  1. Competitive Advantage

Businesses that harness data analytics gain a competitive edge. At Arise SLG, we guide clients in understanding trends and customer preferences, helping them innovate and adapt faster than their competitors.

  1. Better Risk Management

Data analysis helps organizations identify potential risks and develop proactive strategies to mitigate them. Our tailored solutions empower clients to manage crises effectively, safeguarding their operations.

Conclusion

Embracing data-driven decision-making is no longer optional; it’s a necessity for businesses aiming to thrive in a competitive landscape. By investing in data analytics and fostering a culture that values data, organizations can drive growth and achieve long-term success with the support of partners like Arise SLG.

#DataDriven #BusinessIntelligence #AriseSLG #Analytics #StrategicPlanning #MarketTrends #OperationalExcellence


_Instagram Post (3)

Unveiling Consumer Insights: The Strategic Role of Market Research in Driving Business Growth

In today’s competitive business landscape, understanding customer needs and behaviors is essential to create a winning strategy. Market research has evolved far beyond traditional methods, now using digital tools and innovative techniques to yield insights that empower businesses to make informed, consumer-centric decisions.

In this article, we explore the essential role of market research, the steps to execute a successful market research campaign, and real-world examples of its impact.

Why Market Research is a Cornerstone of Strategy

At its core, market research is the process of gathering, analyzing, and interpreting data about a market, including information about the target audience, competitors, and industry trends. Businesses use this information to understand consumer desires, optimize marketing strategies, and identify new opportunities. Today, with the abundance of data available online, organizations can conduct research that is faster, more precise, and more dynamic than ever before. For companies that want to stay agile, market research provides actionable insights that inform strategic decisions.

Types of Market Research

Market research generally falls into two categories: primary and secondary research. Primary Research involves gathering data firsthand through methods such as surveys, interviews, and focus groups. This research is highly customizable and provides direct insight from the target market.

Secondary Research draws on existing data from industry reports, public resources, and competitor analysis. This type of research is cost-effective and offers a broader overview of market trends.

Combining both methods offers a balanced, holistic view of the market and enables businesses to cross-reference findings to increase accuracy.

Key Steps in Conducting Market Research

To achieve actionable insights, a structured approach is essential. Here’s a step-by-step outline
for a successful market research campaign:

1. Define Your Research Objectives

Establish clear goals for your research. What questions do you want to answer? Whether it’s understanding purchasing behavior, identifying brand perception, or gauging customer satisfaction, these objectives will guide your research process.

2. Select Your Research Methodology

Choose between quantitative and qualitative approaches, or a mix of both. Quantitative research focuses on measurable data, like surveys, while qualitative research captures detailed insights through interviews or focus groups.

3. Identify and Segment Your Target Audience

Knowing who you’re researching is as critical as what you’re researching. Segmenting your target audience ensures that you’re gathering relevant insights from the consumers most likely to impact your business.

4. Gather Data Efficiently

Use digital tools such as online surveys, CRM systems, and social listening platforms. This enables you to collect real-time data and gain insights into shifting consumer preferences quickly.

5. Analyze and Interpret Data

Once collected, analyze your data with tools like SPSS, Excel, or other analytics software. Identify patterns, trends, and outliers, and interpret these findings to draw conclusions.

6. Apply the Insights to Your Strategy

With data-backed insights in hand, align your findings with your business objectives. Whether it’s enhancing your product features, improving brand messaging, or refining your marketing channels, these insights should directly influence your strategy.

Real-Life Scenario: PepsiCo’s Market Research for Product Development

PepsiCo’s release of Bubly, their sparkling water brand, provides a powerful example of effective market research. Recognizing an increase in health-conscious consumers, PepsiCo sought to diversify its product offerings. Before the launch, PepsiCo conducted extensive research into consumer health trends, competitive analysis, and customer preferences for natural, low-calorie beverages. This research directly influenced the product’s packaging, flavors, and branding, ultimately leading Bubly to become a strong competitor in the rapidly growing sparkling water market.

The Impact of Digital Tools in Modern Market Research

The advent of digital technology has significantly enhanced the market research process. Today, businesses can utilize AI-driven tools for sentiment analysis on social media, predictive analytics to forecast future trends, and online focus groups to gather real-time consumer feedback. For instance, Google Trends and keyword analysis tools allow businesses to measure consumer interest over time and respond proactively to emerging trends. Social media analytics platforms like Sprout Social and Hootsuite enable real-time consumer listening, providing companies with instant feedback on consumer sentiment and preferences.

The Role of Market Research in Driving Sustainable Growth

Market research is a continuous process. Successful companies treat it as an ongoing strategy rather than a one-time task, enabling them to adapt to market fluctuations, shifts in consumer behavior, and changes in competitive dynamics. By incorporating regular research efforts, businesses can stay responsive, make informed decisions, and continue to meet the evolving needs of their customers.

Final Thoughts

Effective market research equips businesses with the insights they need to remain relevant, understand consumer demand, and make strategic decisions that foster growth. As technology advances, market research becomes even more sophisticated, enabling companies to gain deeper insights with greater accuracy. In a world where consumer preferences are constantly changing, market research is an essential tool to ensure businesses not only survive but thrive in a highly competitive environment.


#MarketResearch #ConsumerInsights #BusinessStrategy #CustomerExperience #DataDriven

Blue and White Creative Business Services Facebook Post (1)

How Business Intelligence Fuels Sustainable Practices for Long-Term Growth

As companies move towards sustainability, one key enabler for driving eco-friendly initiatives is Business Intelligence (BI). BI tools allow businesses to track and analyze their sustainability efforts in real-time, ensuring they are not only meeting regulatory requirements but also improving efficiency and reducing costs. At Arise SLG, we specialize in helping businesses use BI to power sustainable practices for long-term growth.

Why Business Intelligence is Essential for Sustainability

1. Tracking Carbon Footprint: BI tools can monitor energy usage, emissions, and waste management, helping businesses reduce their carbon footprint.

2. Supply Chain Optimization: By analyzing data from suppliers, BI can highlight inefficiencies, allowing companies to make more sustainable sourcing and logistics decisions.

3. Cost Savings Through Efficiency: BI can pinpoint areas where sustainability efforts lead to cost reductions, such as energy savings, waste minimization, and reduced material usage.

Recently, Arise SLG worked with an FMCG company to implement BI solutions that tracked and analyzed energy usage across multiple plants. With the insights gained, the company was able to reduce its energy consumption by 18% and cut costs while also aligning with its sustainability goals.

Conclusion:

Sustainability is the future, and Business Intelligence is the tool that will get you there. With Arise SLG, businesses can integrate BI tools to track and optimize their sustainability initiatives, ensuring long-term growth and eco-friendly practices.


#Sustainability #BusinessIntelligence #AriseSLG #EcoFriendly #BI #CostSavings #DataDrivenSustainability

Data Analytics Services

The Future of Remote Work: How Data Analytics Can Drive Success in a Hybrid Work Environment

The shift to hybrid work is transforming how businesses operate. While remote work offers flexibility, it also presents challenges in communication, collaboration, and employee productivity. By leveraging data analytics, companies can gain the insights needed to navigate this new landscape, ensuring they make informed decisions that benefit both employees and the organization.

How Data Analytics Enhances Hybrid Work

At Arise SLG Consulting, we specialize in helping businesses make sense of their data to
optimize work models. In a hybrid environment, data analytics can help identify key trends and
performance metrics that guide business decisions, such as:

1. Employee Productivity Metrics:

Track how remote teams are performing in terms of
productivity and collaboration, ensuring that both remote and in-office employees are
working efficiently.

2. Employee Satisfaction Data:

Use survey data and engagement metrics to assess the
satisfaction levels of employees in a hybrid model. This helps in understanding the well-
being of your workforce and identifying areas of improvement.

3. Resource Allocation:

Data analytics can help businesses identify whether certain
resources are being over- or under-utilized, allowing for better distribution of resources in
a hybrid work environment.

For one of our clients in the telecom sector, Arise SLG used data-driven insights to track
employee performance and satisfaction during the shift to hybrid work. By analyzing
productivity trends and feedback, we helped the company adjust its work-from-home policies,
boosting efficiency and employee engagement by 25%.

Conclusion:

As the future of work becomes increasingly hybrid, data analytics will be critical in helping
businesses adapt. At Arise SLG, we help organizations leverage data to improve productivity,
engagement, and overall success in the hybrid work era.

#HybridWork #RemoteWork #DataAnalytics #BusinessGrowth #AriseSLG
#EmployeeProductivity #WorkLifeBalance

Dark Blue And White Modern The Power Of Data Presentation

The Power of Data-Driven Decision Making in Business

In today's fast-paced business environment, making informed decisions quickly is crucial. Data-driven decision-making (DDDM) empowers organizations, and at Arise SLG, we specialize in helping businesses leverage data analytics for strategic planning and operational improvements. Here’s why adopting a data-driven approach is essential for success:

1. Enhanced Accuracy

Relying on data reduces the risk of errors associated with gut feelings or anecdotal evidence. At Arise SLG, we assist organizations in implementing data management practices that ensure accurate forecasting and assessments.

2. Informed Strategies

Data analytics provides insights into customer behavior, market trends, and operational performance. We help companies analyze this information to tailor their strategies effectively, meeting market demands head-on.

3. Increased Efficiency

Data-driven processes streamline operations by identifying inefficiencies. Our expertise enables organizations to optimize resource allocation, enhancing productivity and leading to significant cost savings.

4. Competitive Advantage

Businesses that harness data analytics gain a competitive edge. At Arise SLG, we guide
clients in understanding trends and customer preferences, helping them innovate and adapt
faster than their competitors.

5. Better Risk Management

Data analysis helps organizations identify potential risks and develop proactive strategies to
mitigate them. Our tailored solutions empower clients to manage crises effectively,
safeguarding their operations.

Conclusion

Embracing data-driven decision-making is no longer optional; it's a necessity for businesses
aiming to thrive in a competitive landscape. By investing in data analytics and fostering a
culture that values data, organizations can drive growth and achieve long-term success with
the support of partners like Arise SLG.

#DataDriven #BusinessIntelligence #AriseSLG #Analytics #StrategicPlanning
#MarketTrends #OperationalExcellence

Red And White Modern Data Analytics For Better Business Decisions Presentation

Unlocking the Power of Business Intelligence: Harmonizing Structured and Unstructured Data for Smarter Decisions

In today’s data-driven world, businesses must handle both structured (e.g., databases) and unstructured (e.g., social media posts) data. Harmonizing these diverse data sources is essential for extracting actionable insights. Business Intelligence (BI) tools—such as SQL, Python, Power BI, and Tableau—help streamline this process, ensuring seamless data integration and reporting.

What Are Structured and Unstructured Data?

  •  Structured Data: Organized in databases or tables (e.g., sales data, CRM records).
     Unstructured Data: Lacks a predefined structure (e.g., emails, social media,
    customer reviews).

The Challenge:
While structured data is easier to analyze, unstructured data can be disorganized and
difficult to process. Harmonizing both types for decision-making requires robust tools and
processes.


Using SQL, Python, Power BI, and Tableau in BI

1. SQL (Structured Query Language):

SQL is used to query and manage structured data, making it easier to retrieve, filter, and merge data from relational databases. It’s a fundamental tool for handling structured data sets in BI.

2. Python:

Python, with libraries like Pandas and NumPy, is ideal for processing unstructured data. It can perform complex data manipulations and handle text mining and natural language processing (NLP) for unstructured data sources like social media or customer reviews.

3. Power BI and Tableau:

After SQL and Python have been used to process and clean data, Power BI and Tableau come into play for data visualization and reporting. These BI tools provide dynamic dashboards and interactive reports, making it easy to interpret harmonized data and gain actionable insights in real-time.

Real-Life Scenario: Unilever

Unilever effectively uses SQL to manage structured sales data from retail stores and Python to analyze unstructured customer feedback from social media. After processing the data, they rely on Power BI to create dashboards that provide a clear visual representation of customer trends and sales performance, allowing them to make informed business decisions
in real-time.

At Arise SLG, we specialize in integrating SQL, Python, and BI tools like Power BI and Tableau to help businesses harmonize their structured and unstructured data. Our solutions streamline data processing, create insightful visualizations, and ensure you can make faster, data-driven decisions with confidence.

With the combined power of SQL, Python, Power BI, and Tableau, businesses can effectively harmonize structured and unstructured data for comprehensive analysis. At Arise SLG, we help companies unlock the full potential of their data, transforming it into a strategic asset that drives smarter decisions.


#BusinessIntelligence #SQL #Python #PowerBI #Tableau #DataIntegration #StructuredData
#UnstructuredData #AriseSLG #CustomerInsights

SSSS

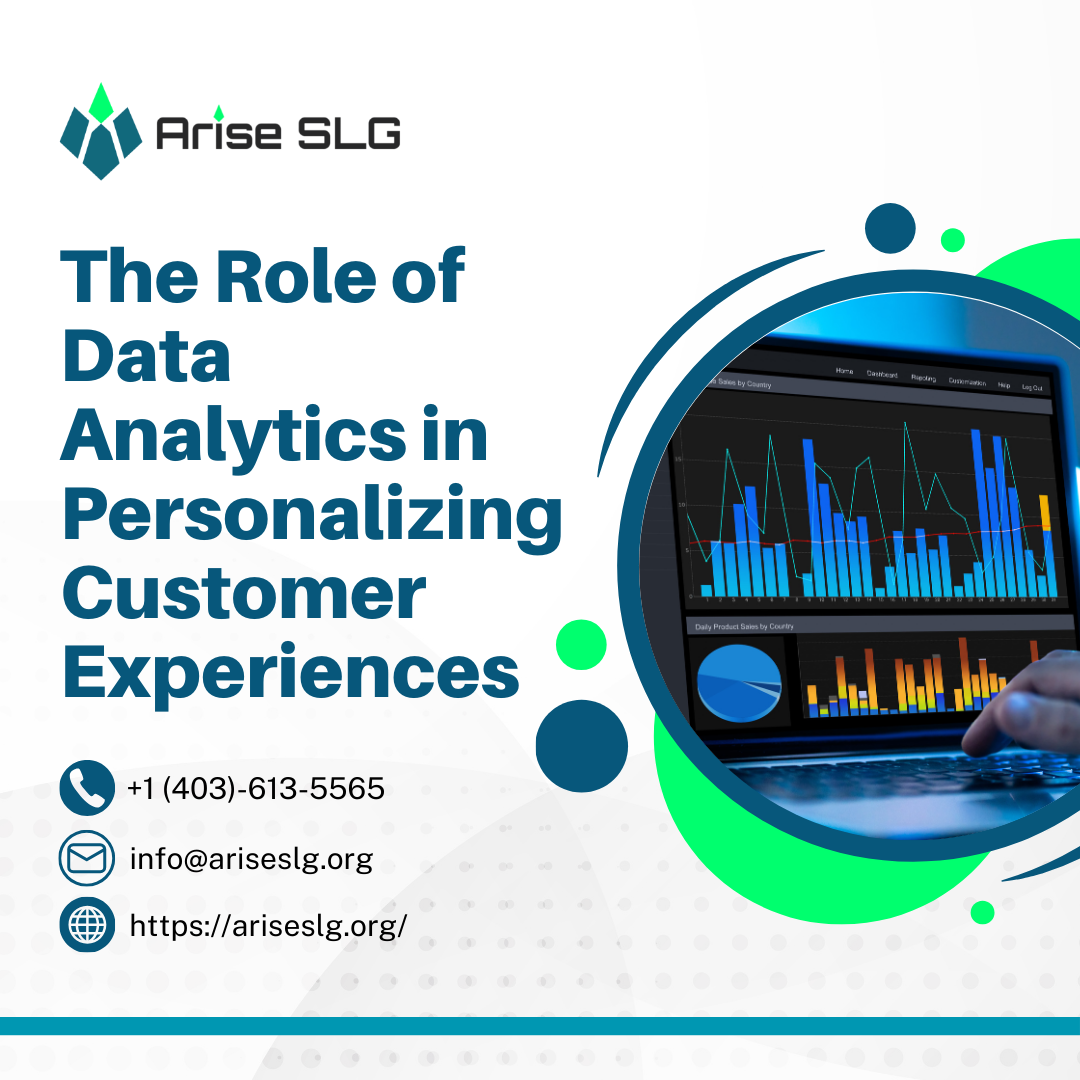
The Role of Data Analytics in Personalizing Customer Experiences

In today’s digital age, customers expect personalized experiences from the brands they interact with. Companies are no longer competing solely on product or price—delivering a personalized, customer-centric experience has become a critical differentiator. Data Analytics plays a pivotal role in making this possible, enabling businesses to gather insights about customer behavior, preferences, and interactions, and use that information to create tailored experiences that drive loyalty and satisfaction.


Why Personalization Matters: Consumers today are more empowered than ever. They have access to a wealth of information and options, making it easy for them to switch brands if their needs aren’t being met. Personalization allows businesses to stand out by offering solutions, products, and content that meet specific customer preferences.

This approach leads to:

  • Higher customer engagement
  • Increased conversion rates
  • Improved brand loyalty


How Data Analytics Drives Personalization

1. Collecting Customer Data: The first step to personalization is gathering relevant customer data. This includes structured data (like purchase history, demographic information) and unstructured data (such as social media interactions and customer reviews). By integrating data from multiple touchpoints, businesses can create a 360-degree view of their customers.

2. Segmenting Audiences: Data analytics tools, like Power BI and Tableau, help businesses analyze this data and create meaningful customer segments based on behavior, preferences, and purchase patterns. For example, an online retailer can use analytics to identify which customers are more likely to purchase specific product categories during certain seasons.

3. Predictive Analytics for Personalization: With predictive analytics, companies can forecast customer behaviors and tailor their offerings. Machine learning models analyze past behaviors and trends to predict what a customer might want or need next. For instance, Netflix uses predictive analytics to recommend shows based on viewers’ previous interactions with the platform.

4. Real-Time Personalization: Through real-time data analytics, companies can offer dynamic personalization. For example, e-commerce websites can adjust product recommendations, promotions, and even website layouts based on a customer’s real-time browsing behavior.


Amazon is a leader in using data analytics to personalize customer experiences. Every time a customer visits Amazon’s website, they are presented with product recommendations based on their browsing history, past purchases, and even what similar customers have viewed. By leveraging massive amounts of customer data, Amazon delivers a highly tailored shopping experience that keeps customers engaged and coming back.

Amazon’s “Customers Who Bought This Also Bought” feature is powered by data analytics, using machine learning models to recommend products that are more likely to be purchased together. This not only enhances the customer experience but also drives significant upselling opportunities for the company.


The Role of Arise SLG in Driving Personalization Through Data Analytics

At Arise SLG, we help businesses use data analytics to personalize their customer experiences effectively. From collecting and organizing customer data to implementing predictive analytics and building personalized marketing campaigns, we guide organizations through every step of their data journey. With the right tools and insights, companies can deliver the personalized experiences their customers crave, building long-term relationships and boosting engagement.

Conclusion:

Personalization is no longer just a competitive advantage—it’s a customer expectation. With data analytics, businesses can provide more relevant, tailored experiences, ultimately driving higher customer satisfaction and retention. At Arise SLG, we specialize in leveraging data analytics to help businesses achieve true personalization, unlocking the full potential of their
customer interactions.

#DataAnalytics #Personalization #CustomerExperience #AriseSLG #BusinessIntelligence
#PredictiveAnalytics #CustomerEngagement #PowerBI #Amazon #MachineLearning